The same console our 24x7 engineers watch — deployed inside your network, customized to your topology, and left running long after the engagement ends. Health scoring, incident root-cause reconstruction, cross-tier diagnostics, and safe self-service. In one Flask app you own.
Not a stack of Nagios charts. One console, structured so the answer to "is production okay right now?" takes less than three seconds.
Weighted health score across 40+ live checks, one glance. Drilldown into any warning without navigating away from the tab.
CPU, memory, disk, network, mount health, kernel + ulimit posture per tier. Same information you'd pull with top / vmstat / df, unified and history-tracked.
SGA / PGA advisors, wait class distribution, tablespace forecasts, undo pressure, library cache, TEMP usage — sourced from AWR and V$ views, not screen-scraped.
Forms, workflow mailer status, JVM health via jstat, concurrent manager processes, custom top integrity. Every service you'd bounce during a P1 has its status here.
Apply lag, gap detection, transport lag, real-time apply status. Explicit visibility into the thing standby monitoring tools tend to lie about.
Per-host clock diagnosis with a real impact matrix — not a single misleading "CRITICAL" number that fires when the dashboard host itself is drifting.
Pick a window when users complained. The dashboard reconstructs what actually happened — blocker identity, exact wait event, contended object, contributing factors — and produces both technical and management RCAs.
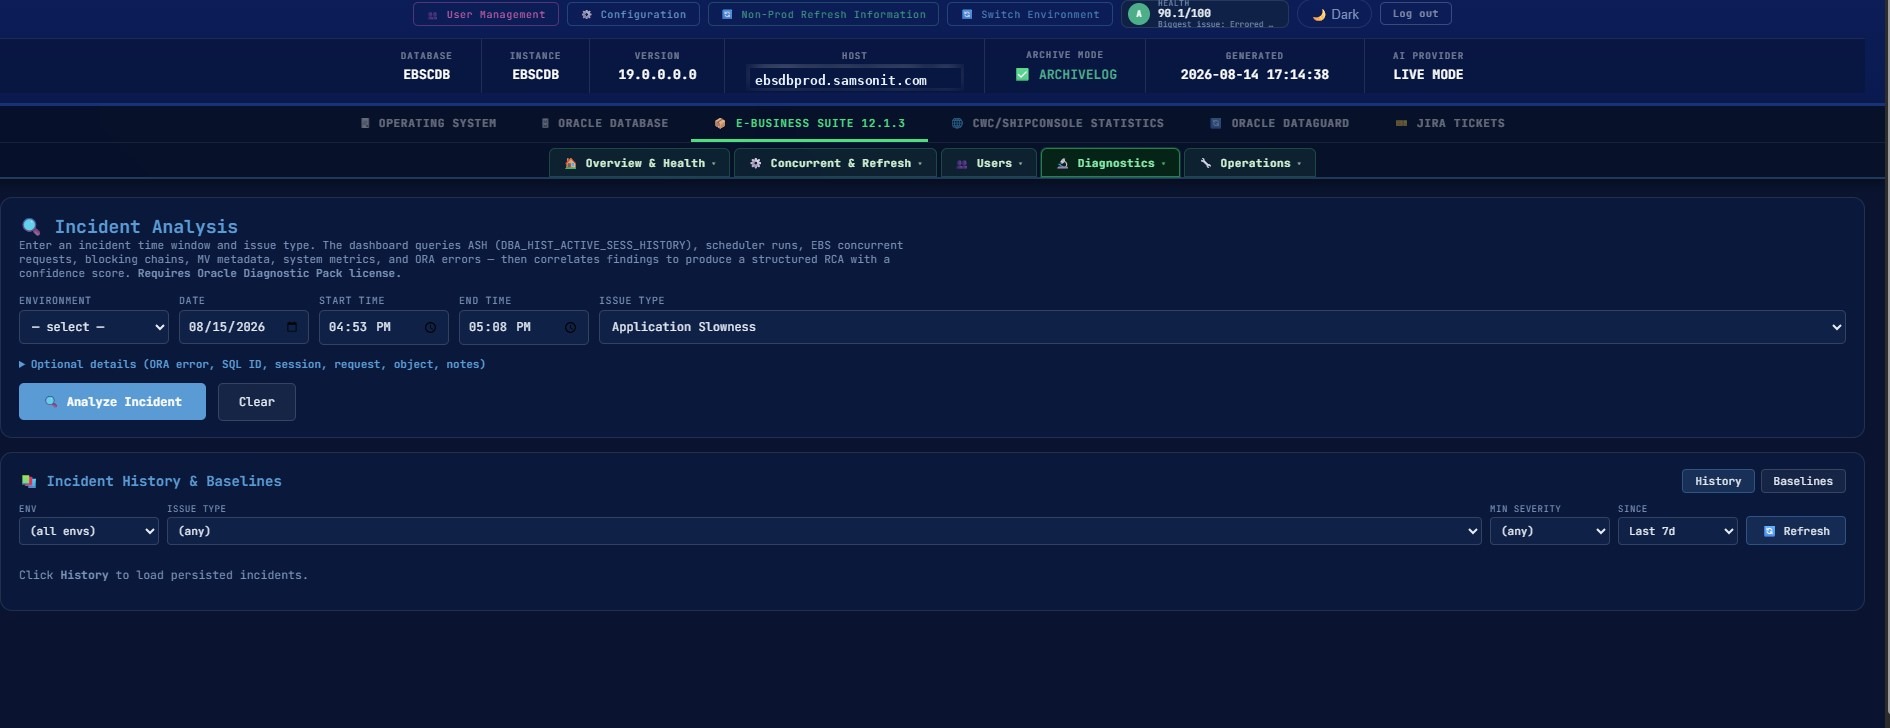
Pick a window when users complained. The dashboard queries DBA_HIST_ACTIVE_SESS_HISTORY, scheduler runs, EBS concurrent requests, blocking chains, MV metadata, and ORA errors — then correlates the findings to produce a structured RCA with a confidence score.
current_obj#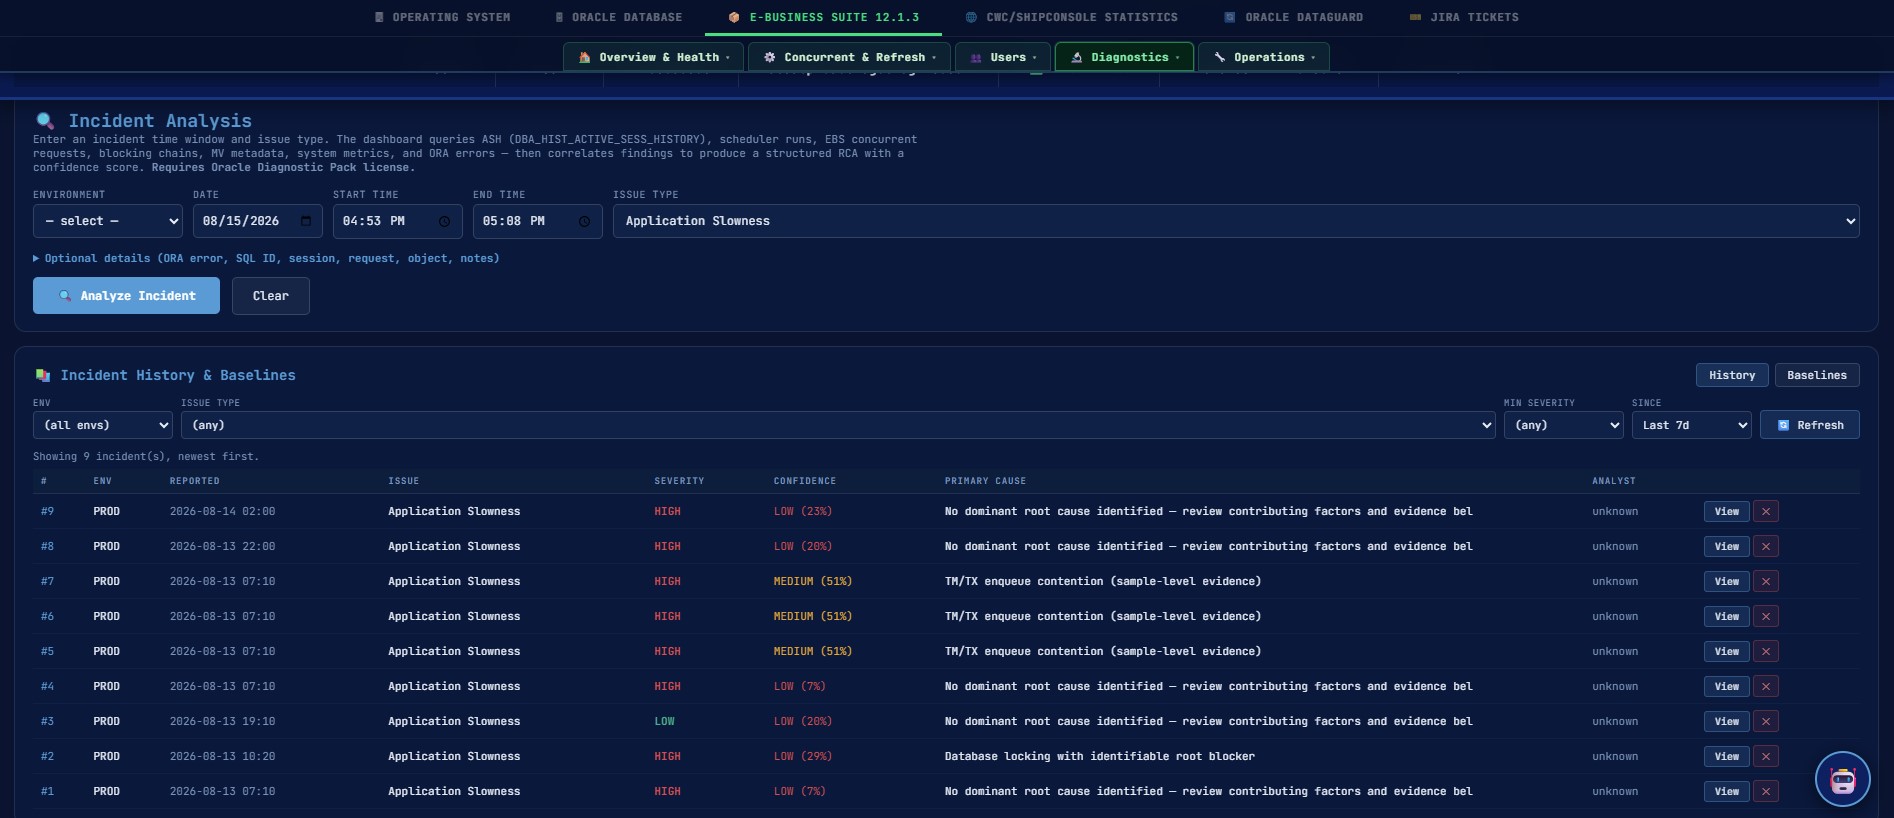
Every incident that gets analyzed is stored in SQLite with its fingerprint, severity, confidence, and primary cause. Filter by env, issue type, min severity, and time window. Click into any row to see the full RCA — technical and management — exactly as it was when the analysis ran.
Password resets, clone runs, maintenance windows, service restarts — each with the guard rails a DBA would insist on before letting help-desk touch the button.
EBS + APEX resets with protected-user blocklists that refuse SYSADMIN, GUEST, APPLSYSPUB, INTERNAL workspace users, and every well-known seeded account. Refusal happens before the DB connection opens.
Pulls the workspace list from APEX_WORKSPACES with a graceful fallback across build variants (column names differ across APEX 5.0 → 23). No more typo-driven tickets.
Checkpointed, resume-safe clone orchestration with per-step audit. Every phase (preflight, restore, recover, rename, post-clone hygiene) tracked and re-runnable.
Pre/post validation baked in. Health snapshot before, health snapshot after, diff written to a report. Nobody wondering "did that change help or hurt?"
Start / stop / status from the same screen. Every action written to the audit trail with actor, time, and outcome.
For the sites still running printed pick tickets and shipping labels — add, enable, disable, restart printers without SSHing to the CUPS box.
Daily or weekly HTML email digests per environment, with a delivery log that records exactly what was sent, to whom, and how big it was.
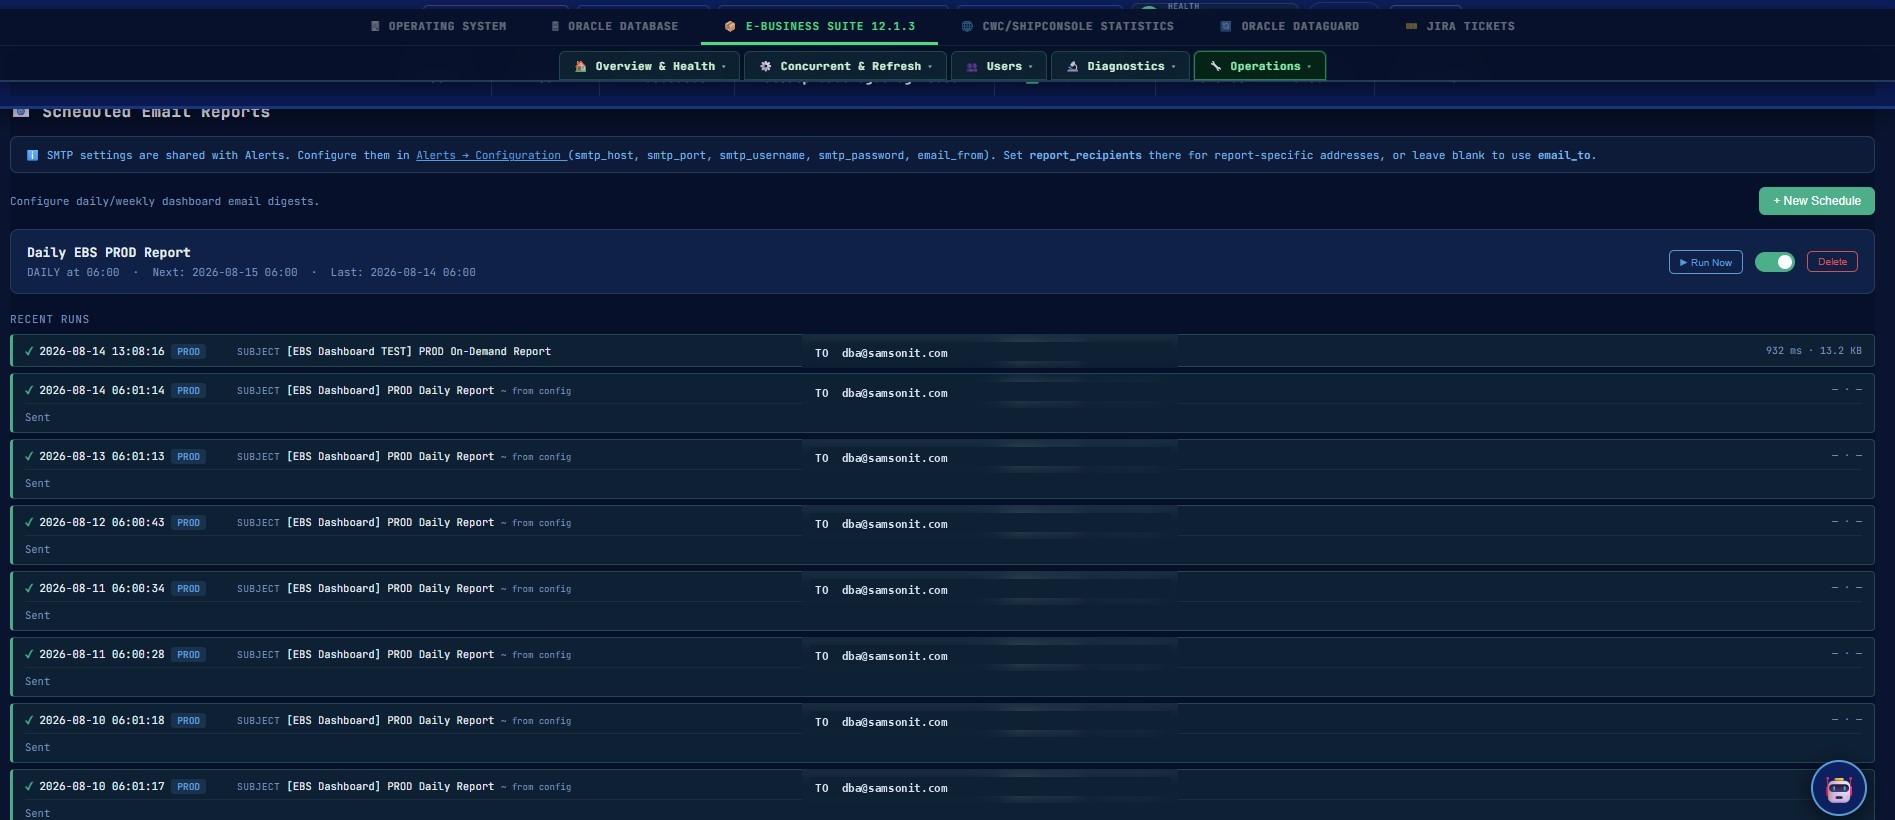
The delivery log shows recipients, subject line, duration, byte size, and per-run success/failure with error text. Historical rows reconstruct display fields from current config so nothing shows as "—" on old runs.
Most monitoring tools show "cross-tier drift: 60 seconds — CRITICAL" and stop. This one tells you which host is drifting and whether it actually matters.
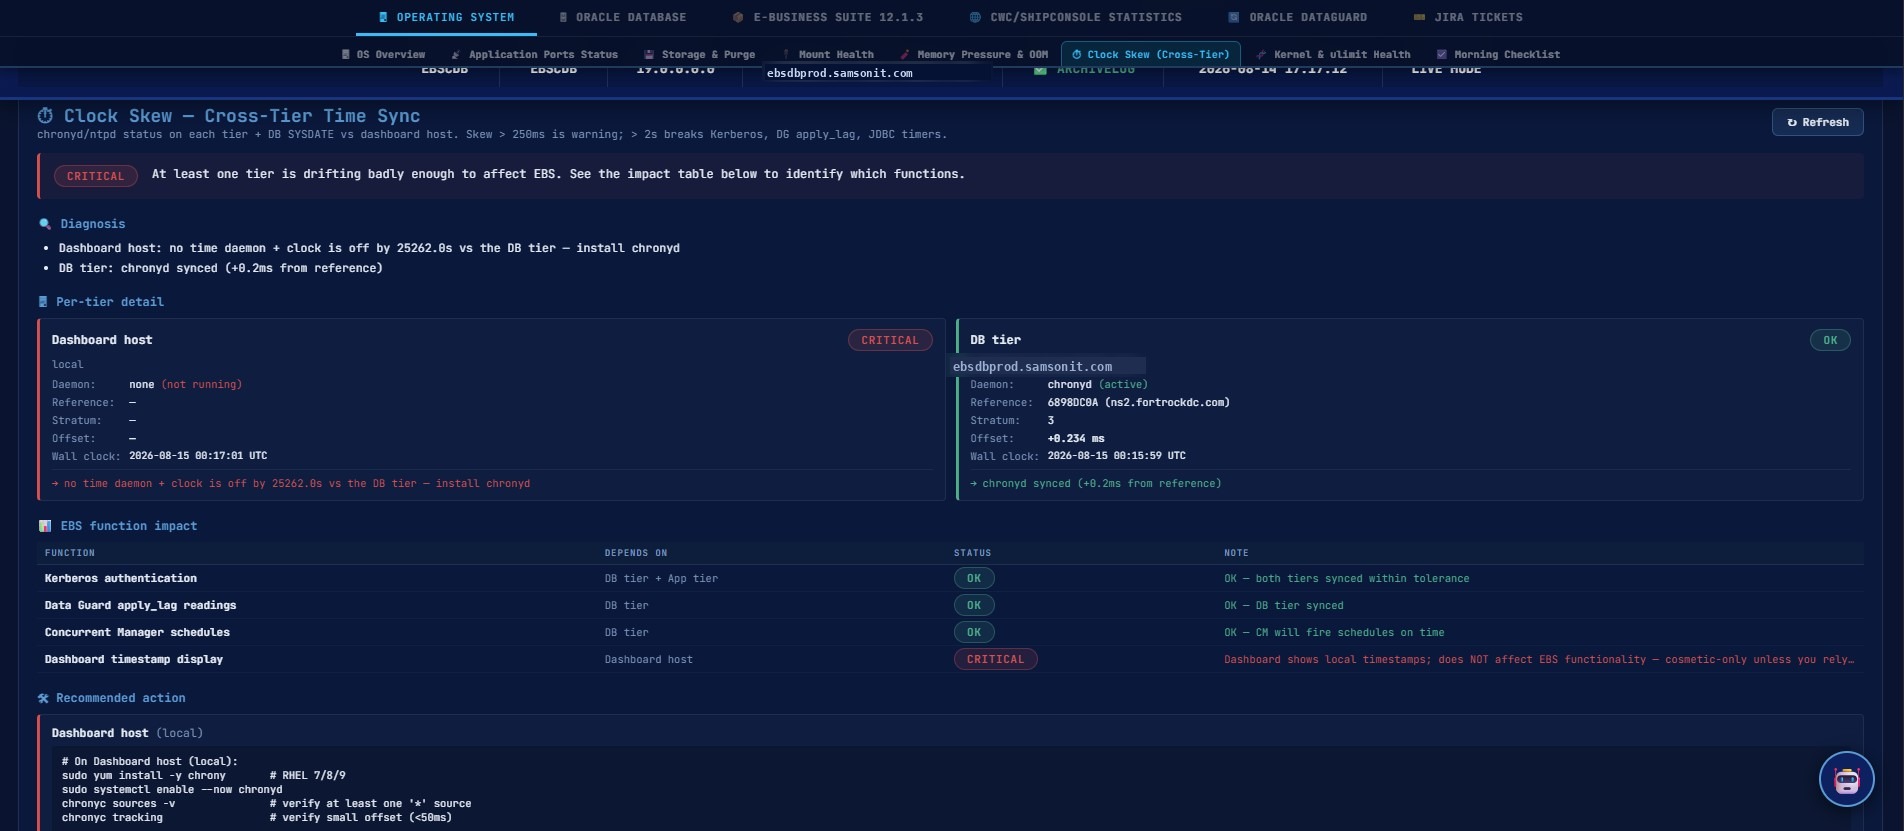
Each host is classified independently against its own daemon offset. An impact matrix then rolls up what's actually affected — because a dashboard host with a drifting clock doesn't break Kerberos, but a DB tier that's drifting does.
Role-based, double-guarded admin actions — session auth AND role check on every destructive endpoint. Two independent checks per request; either failing refuses the call.
Every action written with actor, action, target, IP, session, and result. Persisted in SQLite; exportable to your SIEM.
AES-256 encrypted stored credentials for every environment probe or admin path. Never rendered in the UI. Rotatable without downtime.
Blocklists enforced in both the UI (immediate refusal + popup) and the API (won't even open a DB connection for a blocked target).
First-class tab, not a hidden log — unusual concurrent sessions and identity anomalies surfaced immediately.
Help-desk sees prod status but only touches non-prod. Admins see and touch everything. Policy defined per environment.
A Flask app, one systemd unit, one config file, one virtualenv. Uses the Oracle thick client in oracledb — no separate agent per DB, no seeded schema, no APPS grants beyond documented APIs.
Any RHEL or Oracle Linux host with Python 3.9+ that can reach your DB listeners and (for OS metrics) your DB / App hosts via SSH key. 2 vCPU / 4 GB RAM is comfortable.
Add every EBS instance you want to monitor — production, non-production, DR. Stored credentials (AES-256 encrypted) let the dashboard connect on demand without an agent on the DB hosts themselves.
Quiet observation before anything pages you. Alert thresholds are tuned against your actual baseline, not vendor defaults, so you don't inherit alert fatigue on day one.
Every alert type gets a runbook link. Recipients get the same guidance whether they're on-call at 3 a.m. or triaging during business hours.
Runbook, systemd unit, config walkthrough, alert-rule inventory, and admin account handover all included. Your team gets full documentation, not just a login to a black box.
A 30-minute demo: we show the console live, walk through an incident replay, and answer specific questions about your setup.
Book a 30-minute demo →